HOW IT WORKS
|
The weather charts show the last three days, current month and current year of:
Yellow line shows current data, blue line shows the last year-same date information, for direct comparison. The current month and current year plot charts are updated once a day only. In the last three days charts, vertical light green lines are midnights and dark green vertical lines are noons. Images and weather information automatically update every 30 seconds. | |
|
|
|
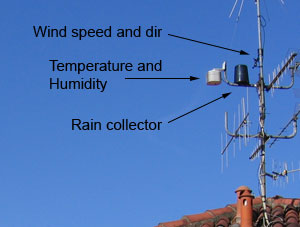
How data are gathered? The system is made with a Davis Weather Monitor II weather station connected to a PC that collects information since 1999 and displays a slideshow of the charts. The PC screen is then modulated in the television home plant, allowing to see it from any TV set. The charts are saved in jpeg format and sent via ftp at every update by an another application in order to have all charts available at the same time. I self developed the application that grabs the image from the webcam (Creative NX Ultra) and saves it in jpeg format, as all the available applications I found on the internet weren't enough stable. | |
Responsibility - Disclaimer
|
CerroMeteo, except for other indications of law, cannot be thought in any way directly responsible of any damages of any nature caused directly or indirectly from the access to the website, of the inability or impossibility to access the website, of the reliability of the news contained in it and their employment. |


